Who Is the Class of 2028?
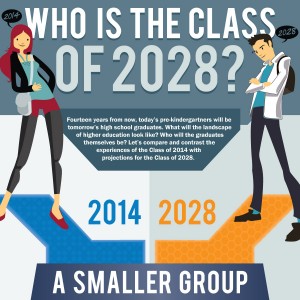
Fourteen years from now, today’s pre-kindergartners will be tomorrow’s high school graduates. What will the landscape of higher education look like? Who will the graduates themselves be? Let’s compare and contrast the experiences of the Class of 2014 with projections for the Class of 2028.
A Smaller Group
The Class of 2028 will be smaller than previous years, proportionately.
During the 2007 recession, fewer children were born, so graduating classes in the mid- to late- 2020s will be smaller, comparatively. (1)
Total U.S. population at time of birth
2014: 265,229,000 in 1996 (2)
2028: 353,276,000 in 2010 (3)
Number of U.S. high school graduates (1)
2014: 3,219,207
2028: 3,251,020
Private schools will be particularly impacted by the change in demographics.
Number of graduates from nonpublic schools (1)
2014: 281,632
2027: 229,210
Variance in the U.S.
Different regions of the country will experience varying rates of growth or decline by the time the Class of 2028 graduates.
Northeastern high school graduates (1)
2014: 608,401
2028: 576,215
Midwestern high school graduates (1)
2014: 716,827
2028: 676,014
Western high school graduates (1)
2014: 748,487
2028: 759,854
Southern high school graduates (1)
2014: 1,142,765
2028: 1,230,247
Diversity is Increasing
In public schools, the number of white non-Hispanic graduates will decrease, while the number of minority graduates will increase. (1)
American Indian/Alaska Native graduates:
2014: 30,076
2028: 35,500
Asian/Pacific Islander graduates
2014: 178,589
2028: 254,044
Black non-Hispanic graduates
2014: 405,165
2028: 417,669
Hispanic graduates
2014: 547,474
2028: 717,570
White non-Hispanic graduates
2014: 1,707,660
2028: 1,530,194
Total public school graduates of all races/ethnicities
2014: 2,868,965
2028: 2,954,977
And non-Hispanic whites will continue to make up the majority of the graduating class, but by a much slimmer margin. (1)
Percentage of non-Hispanic white graduates
2014: 59.5%
2028: 51.8%
Percentage of minority graduates
2014: 40.5%
2028: 48.2%
Looking Ahead to Higher Ed
More students than ever will enter college as nontraditional students. (4)
Students who don’t enter college immediately after high school are considered nontraditional students, and the number of those age 25 and older who are enrolled in college will increase 15.4% between 2014 and 2022. By 2022, that demographic will make up 42.2% of all students enrolled in college.
Number of students enrolled in postsecondary schools in the U.S. (4)
2014: 21,575,000
2022: 23,888,000
Number of students 25 years old and above enrolled in postsecondary schools in the U.S. (4)
2014: 8,723,000
2022: 10,071,000
Colleges of the Future
More students than ever will use the Internet for postsecondary learning. (5)
With the increase in nontraditional students, advances in technology and changing needs of a dynamic population, students may look toward online colleges or e-learning to get the most out of their education.
Number of postsecondary students taking at least one course online (5)
2002: 1,602,970, or 9.6% of total enrollment
2010: 6,142,280 or 31.3% of total enrollment
Percentage of postsecondary students taking at least one course online (5)
2002: 9.6%
2010: 31.3%
Global market for self-paced online learning (6)
2011: $35.6 billion
2016: $51.5 billion
Sources:
1. http://www.wiche.edu
2. http://www.census.gov
3. http://databank.worldbank.org
4. http://nces.ed.gov
5. http://www.babson.edu
6. http://www.ambientinsight.com


